
How to Look Up Tulare County Jail Population Data
Population data for Tulare County jails lives across several official sources. The Sheriff's Detentions Operations page names the three facilities and lists the Detentions Division leader, Captain Buddy Hirayama. It does not post a daily count chart, so a full snapshot needs more than one source. The official inmate listing shows the live in-custody roster. That roster has no capacity column or daily totals. Use it as a raw feed, not a finished report.
The Bureau of Justice Statistics is the main federal data home for jail counts. The BJS site at bjs.ojp.gov posts the Annual Survey of Jails and the Census of Jails. These reports cover Tulare County as part of state and county-level files. The Vera Institute Incarceration Trends tool at incarcerationtrends.vera.org charts county jail trends going back years, drawn from BJS data. The Prison Policy Initiative California profile adds context on confined population by facility type.
Read these sources side by side. The Sheriff's live listing tells you who is in jail right now. BJS reports tell you average daily population by year. Vera shows long-term trends. Prison Policy frames the data against the rest of the state. No single source gives the full story. The local pages update each day. The federal reports lag a year or two.
The Detentions Operations page is the start point for Tulare County jail population research. Detentions Operations shows the three facilities and points to inmate services. From there, click through to the live roster for current names. Pair that with BJS yearly tables to track scale over time. Most readers stop at the Sheriff page. Going to BJS and Vera is what makes a real data lookup.
Tulare County Jail Capacity Overview
The Tulare County Sheriff runs three detention facilities in the county. Each holds a different mix of people. The Detentions Operations page names all three sites by name. It does not list a rated bed count for each one. That gap is noted below. The Sheriff confirms the facilities exist and that the Detentions Division runs them.
| Facility | Rated Capacity | Population Detail |
|---|---|---|
| Bob Wiley Detention Facility | Not posted on official Sheriff source | Confirmed in Detentions Operations page |
| Adult Pre-Trial Facility | Not posted on official Sheriff source | Confirmed in Detentions Operations page |
| South County Detention Facility | Not posted on official Sheriff source | Confirmed in Detentions Operations page |
Rated capacity numbers are not on the Sheriff page that the public can read. The Board of State and Community Corrections holds county jail capacity files, but the Sheriff's own page does not echo those figures. To get a verified bed count, send a request to the Sheriff's records unit or pull the latest BSCC jail profile for Tulare County. Until then, treat the capacity row as a research gap.
Average Daily Population
Average daily population, or ADP, is the mean count of people held in jail across a year. ADP is the figure that the Bureau of Justice Statistics tracks. It smooths out daily swings. Tulare County ADP figures are not posted on the Sheriff's Detentions Operations page in this research pass. The federal BJS Annual Survey of Jails reports ADP at the county level, and the Vera Institute republishes those numbers in chart form.
To pull the most recent Tulare County ADP, start at bjs.ojp.gov and search for the Annual Survey of Jails. Then check the Vera trends tool for the same county. ADP varies year to year based on bookings, court delays, and state realignment. A research gap remains for the most recent local-source ADP number for Tulare County.
Demographic Breakdown
Demographic breakdowns show who is held in jail by race, sex, and age group. The Tulare County Sheriff's public pages do not post a demographic chart for the county jail. The official inmate listing shows name, date of birth, booking date, and arresting agency. Race and ethnicity are not in the listing fields. That means a clean local demographic breakdown is not available from official Tulare sources at the time of this research.
The BJS Annual Survey of Jails publishes race and sex tables at the national and state level. The Prison Policy Initiative California profile shows that Black and Latino people make up a larger share of the jail population than their share of the state population. Tulare County sits in California's Central Valley, where Latino residents make up a large share of the local population. A county demographic table sourced from BJS or BSCC files would close the gap, but it is not in the harvested research.
Note: A full demographic breakdown for the Tulare County jail population is a known research gap; use BJS or BSCC files for the next data refresh.
Pretrial vs Sentenced Population
Jail data splits into two main camps. Pretrial means a person is held while a case moves through court. Sentenced means a person has been found guilty and is serving time. The mix matters. A high pretrial share can point to slow case flow or tight bail rules. A high sentenced share can point to state realignment moving prison-bound people into the county jail.
| Status | Source |
|---|---|
| Pretrial (Tulare County local) | Not posted on Sheriff site; see BJS Annual Survey of Jails |
| Sentenced (Tulare County local) | Not posted on Sheriff site; see BJS Annual Survey of Jails |
| California pretrial average | See Prison Policy CA profile |
| National pretrial average | See BJS Jail Inmates report |
The Adult Pre-Trial Facility name itself signals the pretrial role. The Sheriff sorts people by court status as they move through bookings. The full split is not posted on a county dashboard. BJS state files report the California pretrial share, and that figure tends to track close to the national average. Use that as a working benchmark until local figures publish.
Misdemeanor vs Felony Population
People held in the Tulare County jail face charges that range from low-level misdemeanors to serious felonies. The official inmate listing does not break out charge type as a column. Booking data behind the scenes does track this. State realignment under AB 109 also moved some lower-level felony sentences into county jails rather than state prison, which shifts the felony share upward in many California counties.
Until the Sheriff posts a chart, use BJS state-level tables. The BJS Census of Jails breaks out the percent held on felony charges and the percent held on misdemeanors. California's felony share has risen since the realignment rules took effect. That is a state pattern, and Tulare County is part of that state pattern.
Mental Health and Medical Population
A share of any county jail population needs mental health care or medical care while in custody. The Tulare Superior Court runs a Mental Health Court calendar in its judicial assignments. Mental Health Court routes people with serious mental health needs into treatment tracks. That signals the county jail holds a notable mental health caseload, even if a count is not posted.
BJS publishes special reports on mental health problems in local jails. Those reports show that roughly two in three jail inmates report a recent mental health concern. The Sheriff's Detentions Division does not post a Tulare-only count. The Mental Health Court calendar inside the court system is the closest local signal that this work is active in the county.
National and State Context
National and state context puts Tulare County jail population data in scale. The Bureau of Justice Statistics tracks jail incarceration rates per 100,000 residents. The national rate hovers around 200 per 100,000. The California rate is lower than the national rate, in part because of state-level reforms and realignment. Tulare County's own rate per 100,000 is not posted by the Sheriff but can be drawn from BJS files matched against county population.
| Level | Jail Population per 100k | Source |
|---|---|---|
| Tulare County | See BJS county tables | bjs.ojp.gov |
| California | See Prison Policy CA profile | prisonpolicy.org/profiles/CA.html |
| National | See BJS Jail Inmates report | bjs.ojp.gov |
The Vera Institute tool at incarcerationtrends.vera.org charts the same data over time, county by county. Treat these benchmarks as scale checks. If a local figure looks far off the state average, that is a flag to double check the source. If it tracks close, the data is likely sound.
The Bureau of Justice Statistics is the original federal source for jail population data and supports the rate per 100,000 figures used here.
BJS hosts the Annual Survey of Jails and the Census of Jails, the two reports that anchor most county-level jail trend work. Both pull from sheriff submissions and form the base for the Vera trends tool.
Population Trends Over Time
Jail populations move in cycles. The early 2010s saw a rise in many California counties tied to AB 109 realignment. The early 2020s saw a sharp drop tied to court closures and emergency releases during the pandemic. After that, counts climbed again as courts reopened. Tulare County sits inside those statewide swings, and its own counts likely follow the same broad pattern.
To see the multi-year shape of Tulare County jail population, use the Vera Institute trends tool. The tool plots jail admissions and jail population from BJS files. The Prison Policy Initiative state profile adds prison data so a reader can see the full custody picture. The Sheriff's site does not host a multi-year chart, so these third-party data tools fill that gap.
The Prison Policy Initiative California profile gives the broader state picture that Tulare County sits inside.
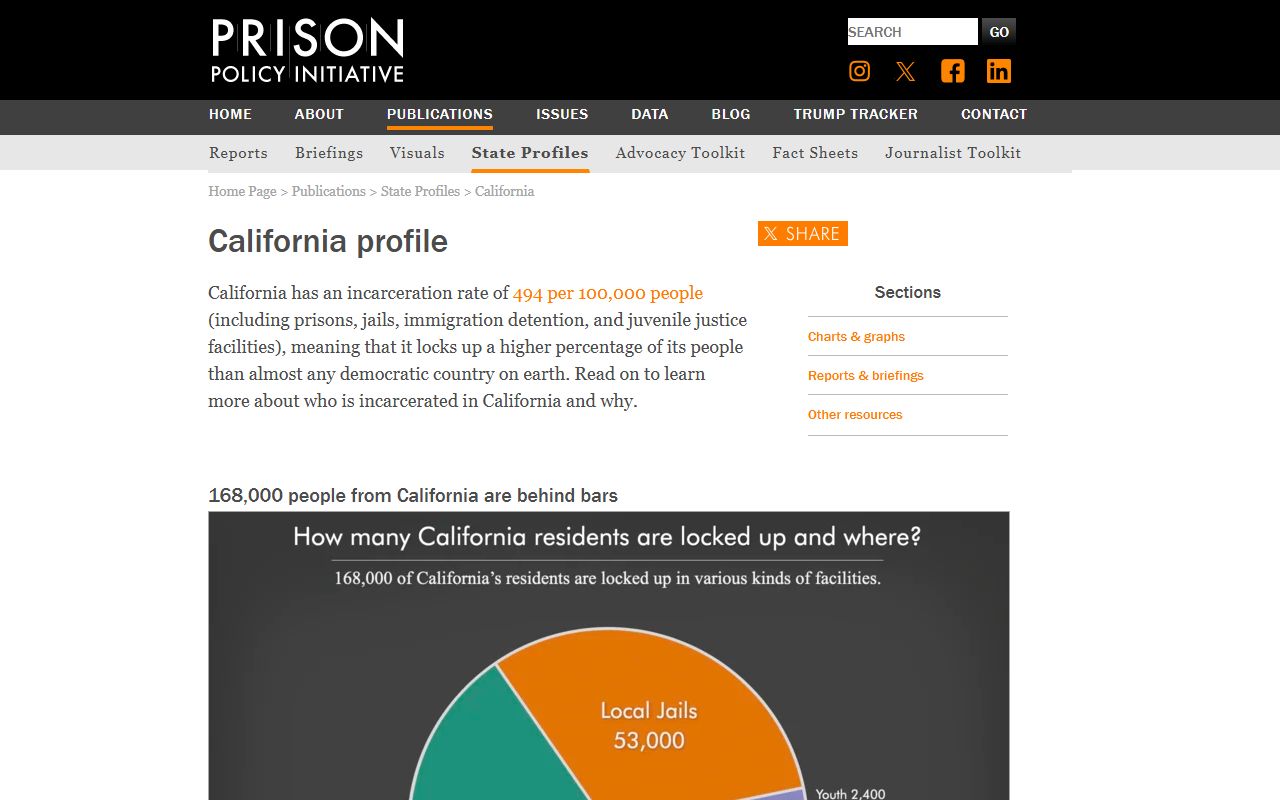
The California profile pairs prison and jail counts in one view, which is useful when reading a county like Tulare alongside state totals.
Searching for Tulare County Inmate Records by Name
This page tracks aggregate jail population data, not individual lookups. For name-based searches of the live Tulare County jail roster, see the dedicated Tulare County inmate records page. That page covers the Sheriff's live listing fields, jacket numbers, booking dates, and arresting agency filters.
Where the Data Comes From
The data on Tulare County jail population flows from three main sources. The Tulare County Sheriff's main site and its Detentions Operations page provide local facility names and the live in-custody listing. The Bureau of Justice Statistics at bjs.ojp.gov provides yearly survey and census data, including average daily population, demographic breakdowns, and rate per 100,000 figures. The Vera Institute at incarcerationtrends.vera.org turns BJS files into county-level trend charts.
The Detentions Division is led by Captain Buddy Hirayama, and Sheriff Mike Boudreaux runs the larger Sheriff's Office. Both names appear on the official county pages tied to detentions and custody. Arresting agencies that show up in the live listing include the Tulare County Sheriff's Office, Visalia Police, Porterville Police, Dinuba Police, Exeter Police, Tulare Police, Farmersville Police, Probation, TCSO, and WPD. That mix of agencies tells you who books people into the three Tulare County jail sites.
Anyone who needs raw data beyond the public pages can file a California Public Records Act request with the Sheriff's records unit or the Board of State and Community Corrections. The CPRA framework gives the public access to jail capacity reports, inspection reports, and aggregated counts. See Tulare County public records for the request steps.